2021.09.30
Current Status of Patent Examination in Japan as seen in "Patent Administration Annual Report 2021"
PATENT
Current Status of Patent Examination in Japan as seen in "Patent Administration Annual Report 2021"
1. Introduction
The Japan Patent Office (JPO) issues once a year "Patent Administration Annual Report" which compiles domestic and international trends over intellectual properties and efforts in JPO. This article introduces the contents related to the patent examination, referring to "Patent Administration Annual Report 2021" issued in July, 2021.
2. Current Status of Patent Examination in Japan
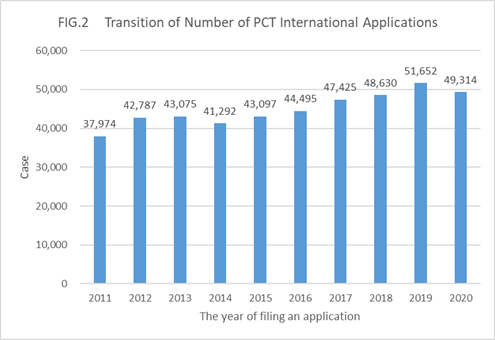
The number of patent applications filed with JPO has continued to decline and has remained at a level of more than 300,000 cases so far; however in 2020, decreased to 288,472 (See FIG. 1). On the other hand, the number of PCT international applications filed with JPO as a receiving office has shown a tendency to increase until 2019, and still remains at a high level, even though 49,314 were filed in 2020, 4.5% down compared to the previous year (See FIG. 2). This seems to reflect the great progress in the globalization of R&D and corporate activities and the further increasing of the importance of the intellectual property strategies not only in Japan but overseas.
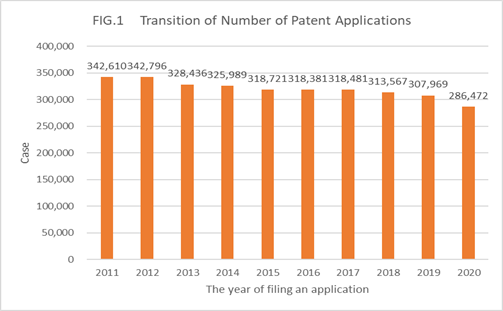
(Note) The number of patent applications is the total number of domestic applications and the number of applications that entered the national phase (The reference date is the date of receipt of domestic documents) of the total international applications based on the Patent Cooperation Treaty (PCT international application).
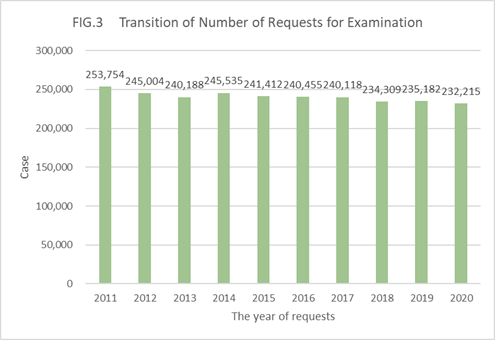
The number of requests for examination has remained almost unchanged between 230,000 and 250,000 cases since 2010, and the latest in 2020 was 232,215 (See FIG. 3).
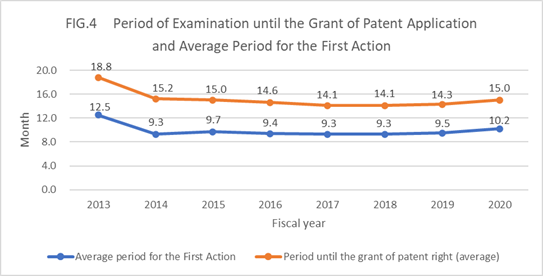
In 2014 JPO set a 10-year goal, which aims that "the period until the grant of patent applications" and "the period until the notification of the First Action" should be within 14 months and 10 months in average, respectively, by the end of the fiscal year of 2023. The data for the fiscal year of 2020 showed 15.0 months and 10.2 months, respectively (See FIG. 4). This reveals that JPO's efforts are steadily advancing and it is close to achieve the target which has not been done yet.
Looking at the number of final decisions of patent applications filed each year, the number of patent registrations has stayed around 170,000 cases. The ratio of patent registrations to the number of patent applications (patent registration rate) is currently around 75%, that is on an increasing tendency. These tendencies imply that applicants carefully select patent applications to be filed and the shift from "quantity" to "quality" is steadily advancing in the intellectual property strategies of companies, etc. (See TABLE 1).
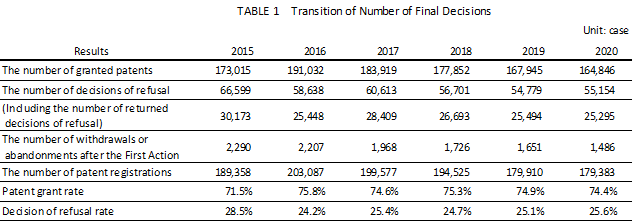
(Notes) "The number of returned decisions of refusal" means the number of cases in which the decision of refusal was made without any response to examiner's notice of reasons for refusal.
"The number of withdrawal or abandonment after the First Action" means the number of cases in which the application was withdrawn or abandoned after the commencement of the first examination.
Patent grant rate = the number of granted patents / (the number of granted patents + the number of decisions of refusal + the number of withdrawals or abandonments after the First Action)
Decision of refusal rate = (the number of decisions of refusal + the number of withdrawals or abandonments after the First Action) / (the number of granted patents + the number of decisions of refusal + the number of withdrawals or abandonments after the First Action)
3. Comparison with the Five Major Patent Offices
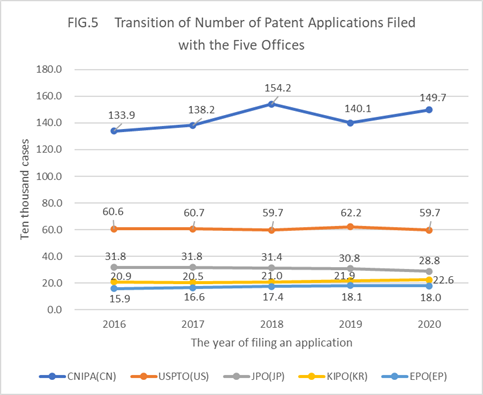
The following graph (FIG. 5) shows the tendency in the number of patent applications filed with the five major patent offices, including the Japan Patent Office (JPO), the U.S. Patent and Trademark Office (USPTO), the European Patent Office (EPO), the Chinese National Intellectual Property Administration (CNIPA), and the Korean Intellectual Property Office (KIPO).
(Material)
Japan: Statics/Materials section Chapter 1-1.
U.S.: US website (2016) and Materials provided by US (2017-2019, 2020 (provisional value))
Europe: Patent Index 2020 (European patent applications)
China: China's website and materials provided by China (provisional value in 2020)
Korea: Korea's website and materials provided by Korea (provisional value in 2020)
This shows that the number of applications filed with CNIPA is prominently high, followed by USPTO and JPO in the descending order of the applications. The number of applications filed with JPO in 2020 was 288,000 cases, which shows a decrease from the previous year. Among the five patent offices, the number of applications filed with CNIPA was 1,497,000, showing 6.8% increase from the previous year 2019, in which the number of applications were significantly decreased.
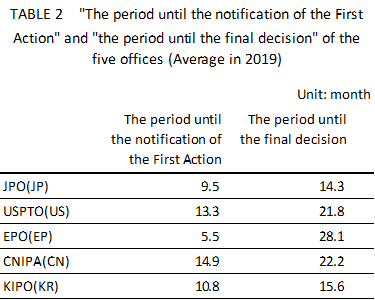
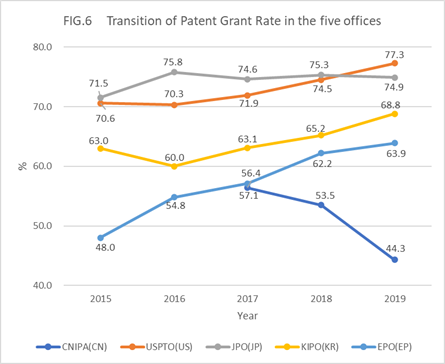
The average value, collected in 2019 regarding the five offices, of the period until the notification of the First Action and the period until the final decision is shown in TABLE 2 below. Each definition of the period until the notification of the First Action and the period until the final decision in the five offices is different based on each patent system. For instance, in JPO, the definition of the period until the notification of the First Action is the average period from the date of the request for examination to the First Action. In EPO, its definition is the average period from the filing date to the First Action. In CNIPA, its definition is the average period from the commencement of the substantive examination (issuance of its notification) following the request of examination to the First Action (See the notes of TABLE 2). Also, the patent grant rate of the five offices in 2019 increased from the previous year, except for JPO and CNIPA. The patent grant rate in JPO is 74.9% decreased by 0.4 points from the previous year, but the same in EPO is continuously increased, 63.9% which is 1.7 points up from previous year. Further, each of the patent grant rates in USPTO and KIPO in 2019 increased by 2.8 points to 77.3% and by 3.6 points to 68.8% from the previous year, respectively. On the other hand, the patent grant rate of CNIPA in 2019 decreased by 9.2 points from the previous year to 44.3% (See FIG. 6). Additionally, each definition of the patent grant rate in the five offices is different based on each patent system (See the notes of FIG. 6).
(Notes)
・The values of the period until the notification of the First Action and the period until the final decision in JPO are the average of the fiscal year of 2019.
・The period until the notification of the First Action shown in JPO and KIPO is the average period from the date of request for the examination to the First Action.
・The period until the notification of the First Action in USPTO is the average period from the filing date to the First Action.
・The period until the notification of the First Action in EPO is the average period from the filing date to the First Action.
・The period until the notification of the First Action in CNIPA is the average period from the commencement of the substantive examination following to the request for the examination to the First Action.
・The period until the final decision in JPO, namely, the period until the grant of patent applications (standard examination period) is the average period from the date of request for the examination to the date of withdrawal, abandonment or the receipt of the final decision (except for the case where JPO asks an applicant to respond again for the reasons attributable to amendment, etc. made by the applicant, or the case where the applicant takes any procedure approved therefor such as the request of extension of the response period or accelerated examination, etc.).
・The period until the final decision in USPTO is the average period from the filing date to the date of abandonment or the receipt of the final decision (including plant patents and re-examinations).
・The period until the final decision in EPO is the median value from the commencement of the substantive examination to the final decision.
・The period until the final decision in CNIPA is the average period from the commencement of the substantive examination to the final decision.
・The period of the final decision in KIPO is the value obtained by dividing the examination period (total number of months) required for making the final decision of all applications that the final decision was made in each year, by the number of final decisions in each year.
(Materials) The values of other countries' patent offices are created by JPO based on IP5 Statistics Report 2019.
(Notes) The definition of the patent grant rate of each country's patent office is as follows:
(The number of cases processed in each year is the target)
Japan: The number of granted patents / (the number of granted patents + the number of decisions of refusal + the number of withdrawals or abandonments following to the commencement of examinations)
U.S.: The number of patent certificates issued / the number of cases processed
Europe: The number of granted patents / (the number of granted patents + the number of decisions of refusal + the number of abandonments)
Korea: The number of granted patents / (the number of granted patents + the number of decisions of refusal + the number of withdrawals following to the commencement of examinations)
China: The definition of patent grant rate has not been in public
(Materials) This is created by JPO based on IP5 Statistics Report 2019
According to the figures above, the period until the notification of the First Action is prominently short in EPO, followed by JPO and KIPO. In addition, the patent grant rate is increasing year by year in each office except for CNIPA, and the same in USPTO and JPO exceeded 70% in 2019, followed by KIPO and EPO in the 60% range and only CNIPA in the 40% range.
4. Conclusion
Although the number of patent applications filed with JPO is decreasing year by year, it has the 3rd largest number of patent applications in the world next to CNIPA and USPTO. With respect to the examination, it is apparent that the period until the notification of the First Action and the period until the grant of patent applications are relatively short, and the patent grant rate is high in comparison with the other offices among the five. The factors led to this situation noted above include the outsourcing to some registered search organizations of the prior art document search which was conducted by examiners, the increase in the number of examiners by hiring fixed term examiners, introduction of the systems such as accelerated examination and super-accelerated examination (For the details, refer to http://www.rc-iplaw.com/newsletter/patent27/) and so on. Improving the quality of the prior art document searches and expediting examinations can be compatibly achieved through these measures.